Storm Summary with Continuous Profile of the 2007-2008 Winter
Season (November - April) - 14 Storms
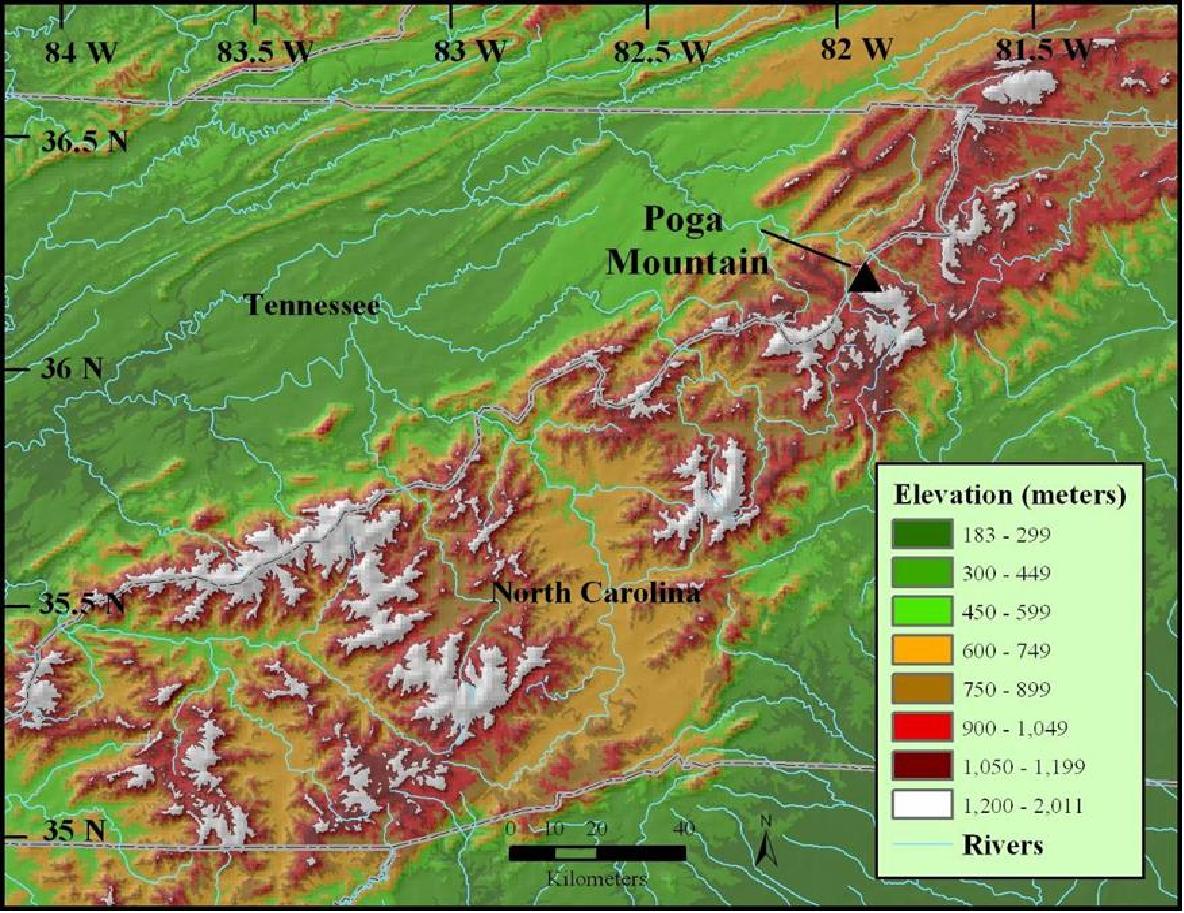
Poga Mountain, North Carolina ( Elevation: 1137 m)
|
|
| Home
Storm Summary of the 2006-2007 Winter Season (November - April)
Storm Summary of the 2007-2008 Winter Season (November - April)
Storm Summary of the 2008-2009 Winter Season (November - April)
SWE = Snow-water equivalent
Blue highlighted rows: Snow, freezing rain, sleet, or mixed cases
Grey highlighted rows: Virga or mix of virga and rain, no snow
| * = average for snow days only |
| ** = general trend 6 hours before storm |
| Tall |
(> 4.0 km AGL) |
|
Continuity for Storm Maturity |
| Borderline |
( 2.5-4.0 km AGL) |
|
Scattered: Several Breaks |
| Shallow |
(< 2.5 km AGL) |
|
|
|
 |
| Storm Summary |
Rain |
|
Rain to Virga (to Rain) |
|
Virga to Rain (to Virga) |
|
Rain/Virga |
|
Rain to Snow |
|
Snow (to Virga) |
|
Virga (to Rain) to Snow |
|
Virga (to Snow to Virga) |
|
|
| Continuity |
Continuous |
|
Scattered |
|
Continuous (Snow) |
|
Scattered (Snow) |
|
|
| AGL |
Tall |
|
Tall to Borderline |
|
Tall to Shallow |
|
Borderline |
|
Borderline to Shallow |
|
Borderline to Tall |
|
Shallow (to Tall) |
|
|
| Average |
All |
Page |
Temp. (°C) |
5.1 |
7.5 |
Wind Direction |
218° |
174° |
Wind Speed (m/s) |
3.3 |
3.2 |
Duration (hrs) |
14.8 |
12.0 |
Snowfall (in) * |
0.33 |
0.33 |
|
|
|
|
Trends |
Wind Direction |
Temperature |
RH |
Pressure |
Year |
Month |
Day |
Type |
AGL |
Start Time (UTC) |
Duration (hrs) |
Avg. Temp. (°C) |
Avg. |
At Snow Storm Maturity |
Wind Speed (m/s) |
Snowfall (in) |
SWE (in) |
before** |
during |
before** |
during |
before** |
during |
2007 |
12 |
3 |
|
Tall |
00:00 |
8.5 |
11.2 |
SW |
-- |
3.4 |
-- |
-- |
increasing |
up - down |
increasing |
increasing |
decreasing |
decreasing |
2007 |
12 |
5 |
|
Tall to Borderline |
06:00 |
21 |
0.9 |
SW |
W |
3.0 |
0.2 |
0.09 |
increasing |
up - down |
flat |
increasing |
decreasing |
down - up |
2007 |
12 |
9 |
|
Tall to Borderline |
16:00 |
4.5 |
14.4 |
SW |
-- |
1.1 |
-- |
-- |
increasing |
decreasing |
decreasing |
increasing |
flat |
decreasing |
2008 |
1 |
16 |
|
Tall |
22:00 |
18.5 |
-3.9 |
E |
E |
4.6 |
1.8 |
0.33 |
decreasing |
decreasing |
increasing |
increasing |
decreasing |
decreasing |
2008 |
2 |
3 |
|
Tall |
22:00 |
5 |
6.0 |
SE |
-- |
2.1 |
-- |
-- |
increasing |
decreasing |
decreasing |
increasing |
decreasing |
up - down |
2008 |
2 |
4 |
|
Tall |
16:30 |
7 |
11.0 |
SE |
-- |
1.1 |
-- |
-- |
increasing |
decreasing |
flat |
increasing |
increasing |
flat |
2008 |
2 |
6 |
|
Tall |
14:30 |
7 |
12.5 |
S |
-- |
3.5 |
-- |
-- |
decreasing |
down - up |
increasing |
up - down |
decreasing |
decreasing |
2008 |
2 |
17 |
|
Borderline to Tall |
18:00 |
10.5 |
9.3 |
SE |
-- |
3.7 |
-- |
-- |
increasing |
increasing |
increasing |
flat |
decreasing |
decreasing |
2008 |
2 |
24 |
|
Tall to Shallow |
15:00 |
14 |
1.4 |
S |
-- |
1.9 |
-- |
-- |
increasing |
decreasing |
decreasing |
down - up |
increasing |
decreasing |
2008 |
3 |
4 |
|
Tall to Shallow |
12:00 |
24 |
6.8 |
SW |
NW |
4.0 |
trace |
0.01 |
increasing |
decreasing |
increasing |
flat |
decreasing |
down - up |
2008 |
3 |
7 |
|
Tall |
12:00 |
5.5 |
5.6 |
SE |
-- |
7.7 |
-- |
-- |
decreasing |
increasing |
increasing |
increasing |
decreasing |
decreasing |
2008 |
3 |
29 |
|
Tall to Borderline |
21:30 |
16 |
0.2 |
E |
-- |
5.6 |
-- |
-- |
decreasing |
decreasing |
flat |
down - up |
flat |
increasing |
2008 |
4 |
25 |
|
Tall |
21:00 |
3.5 |
18.3 |
S |
-- |
2.0 |
-- |
-- |
up - down |
decreasing |
up - down |
increasing |
decreasing |
flat |
2008 |
4 |
27 |
|
Tall |
19:30 |
23 |
10.8 |
SW |
-- |
1.6 |
-- |
-- |
decreasing |
decreasing |
increasing |
down - up |
decreasing |
decreasing |
Version 1.2, 18 August 2011
web page credits: Micheal Tai Bryant, Sandra Yuter, L. Baker Perry
This research is a collaboration between the
Department of Marine, Earth, and Atmospheric Sciences, North Carolina State University
and the Department of Geography and Planning, Appalachian State University
This material is based upon work supported by the National Science
Foundation under Grant No. 0544766. Any opinions, findings and
conclusions or recomendations expressed in this material are those of
the author(s) and do not necessarily reflect the views of the National
Science Foundation (NSF).
contacts:
Dr. Sandra Yuter seyuter@ncsu.edu
Dr. L. Baker Perry perrylb@appstate.edu