ROSE Mission Statement
The overarching goal of the Radar Observations of Storms for Education (ROSE) project is to provide materials for university classroom use that facilitate the interpretation of authentic data to explain key kinematic and microphysical features within mesoscale storms. This goal is motivated by findings from the STEM education research-- that the educational value of conceptual models is maximized when students are able to compare and contrast the model with real data and identify weaknesses in the simplified model. The target audience for these materials are upper level undergraduate and graduate students in mesoscale meteorology courses.
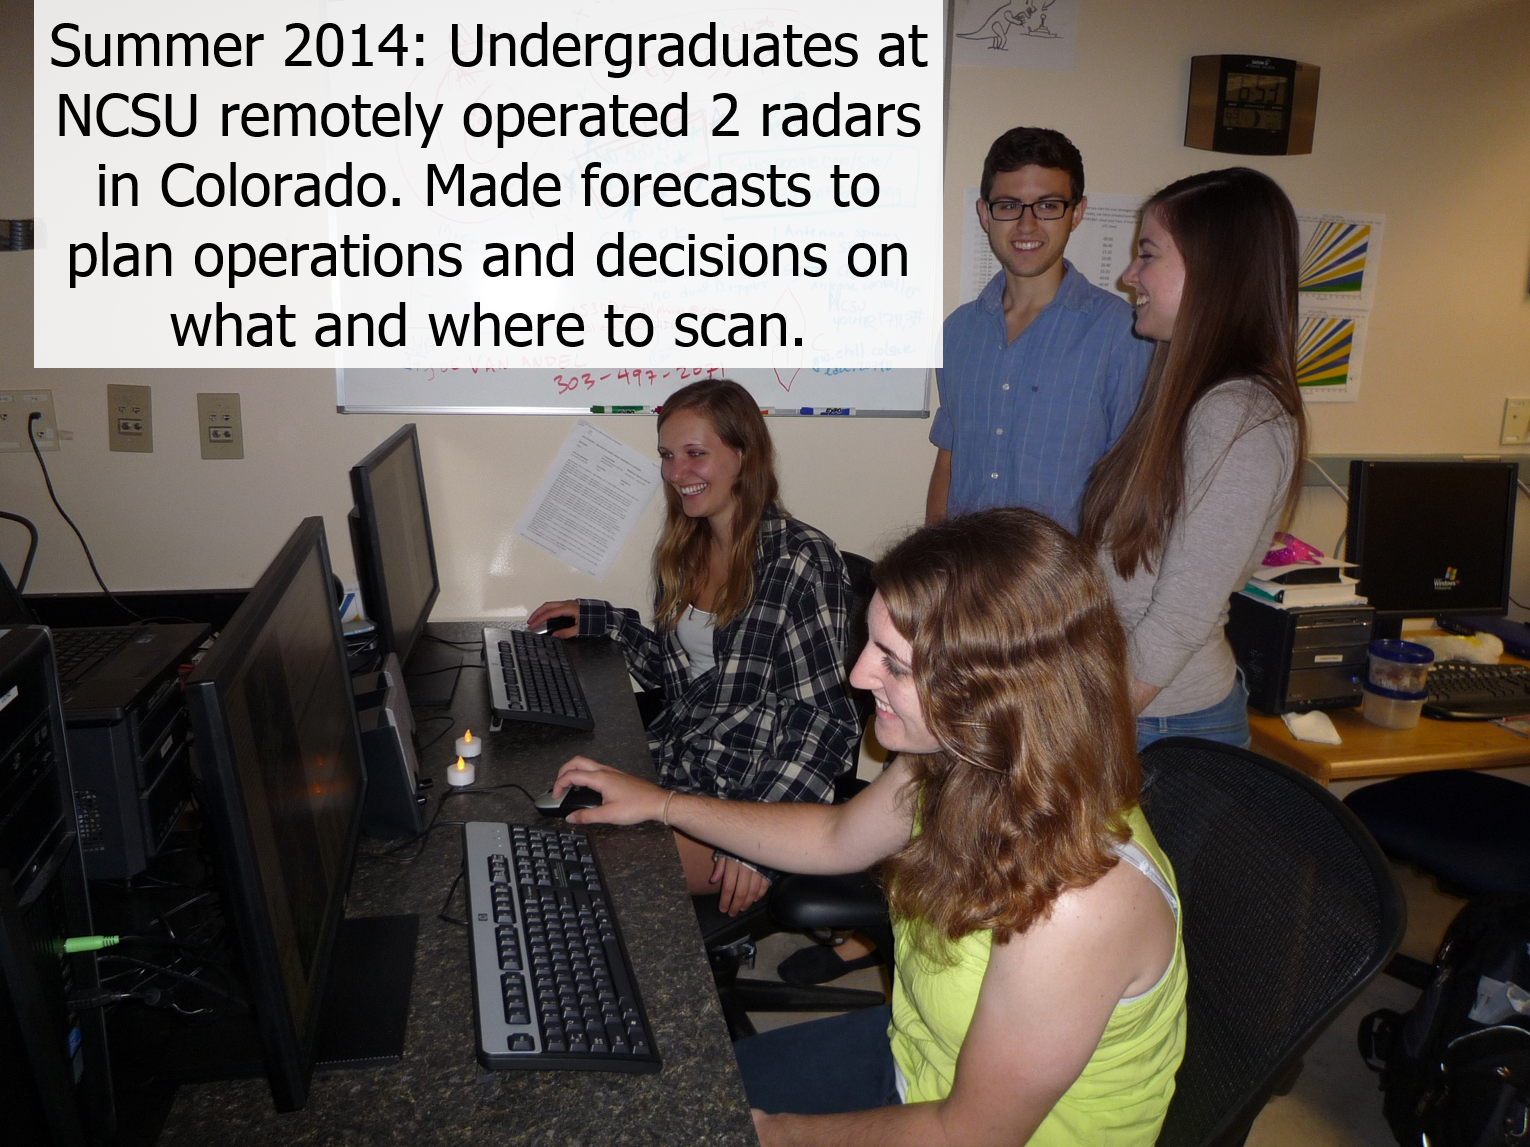
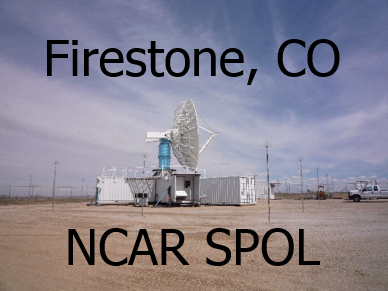
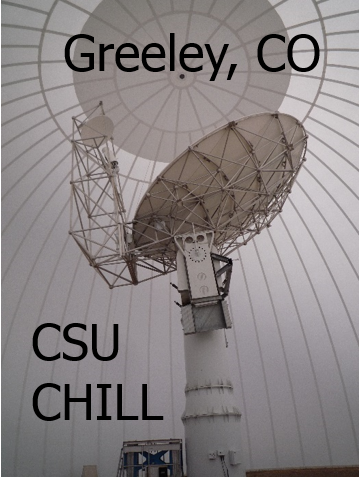
The CSU CHILL and NCAR EOL SPOL radars in north central Colorado were operated in coordinated scanning modes during 18 storms from 20 May to 20 June 2014. Undergraduate students made daily forecasts and decisions on when to schedule radar operations. Once storms were in the radar domain, the students anticipated storm motion and development and made real-time decisions on where to scan vertical cross-sections. Both the CSU CHILL and NCAR EOL SPOL radar were operated remotely by the students in Raleigh, NC. Vertical cross-sections (radar range-height indicators, RHIs) are particularly useful to explain storm structures to students. However, there are few RHIs available for this purpose within the community since informed real-time decisions need to be made on where to scan. Storms observed included ordinary air mass thunderstorms, supercells, a tornadic supercell, hail storms, and multicellular storms with and without stratiform precipitation.
Subsequent to completion of the field phase we have spent considerable time on radar quality control issues including removal of non-meteorological echo and radial velocity dealiasing. The goal is to make our presentations of storm structures accessible to novice users of radar data. Our radar plots use a 1:1 aspect ratio which allows the student to more easily interpret horizontal and vertical flow within the storm. We are also simplifying the data by emphasizing hydrometeor categories rather than radar reflectivity. Additionally, we are exploring use of spectral width to illustrate channels of airflow and where speed/directional shear is present within the storm.