
 |
 |
 |
 |
 |
 |
|
|
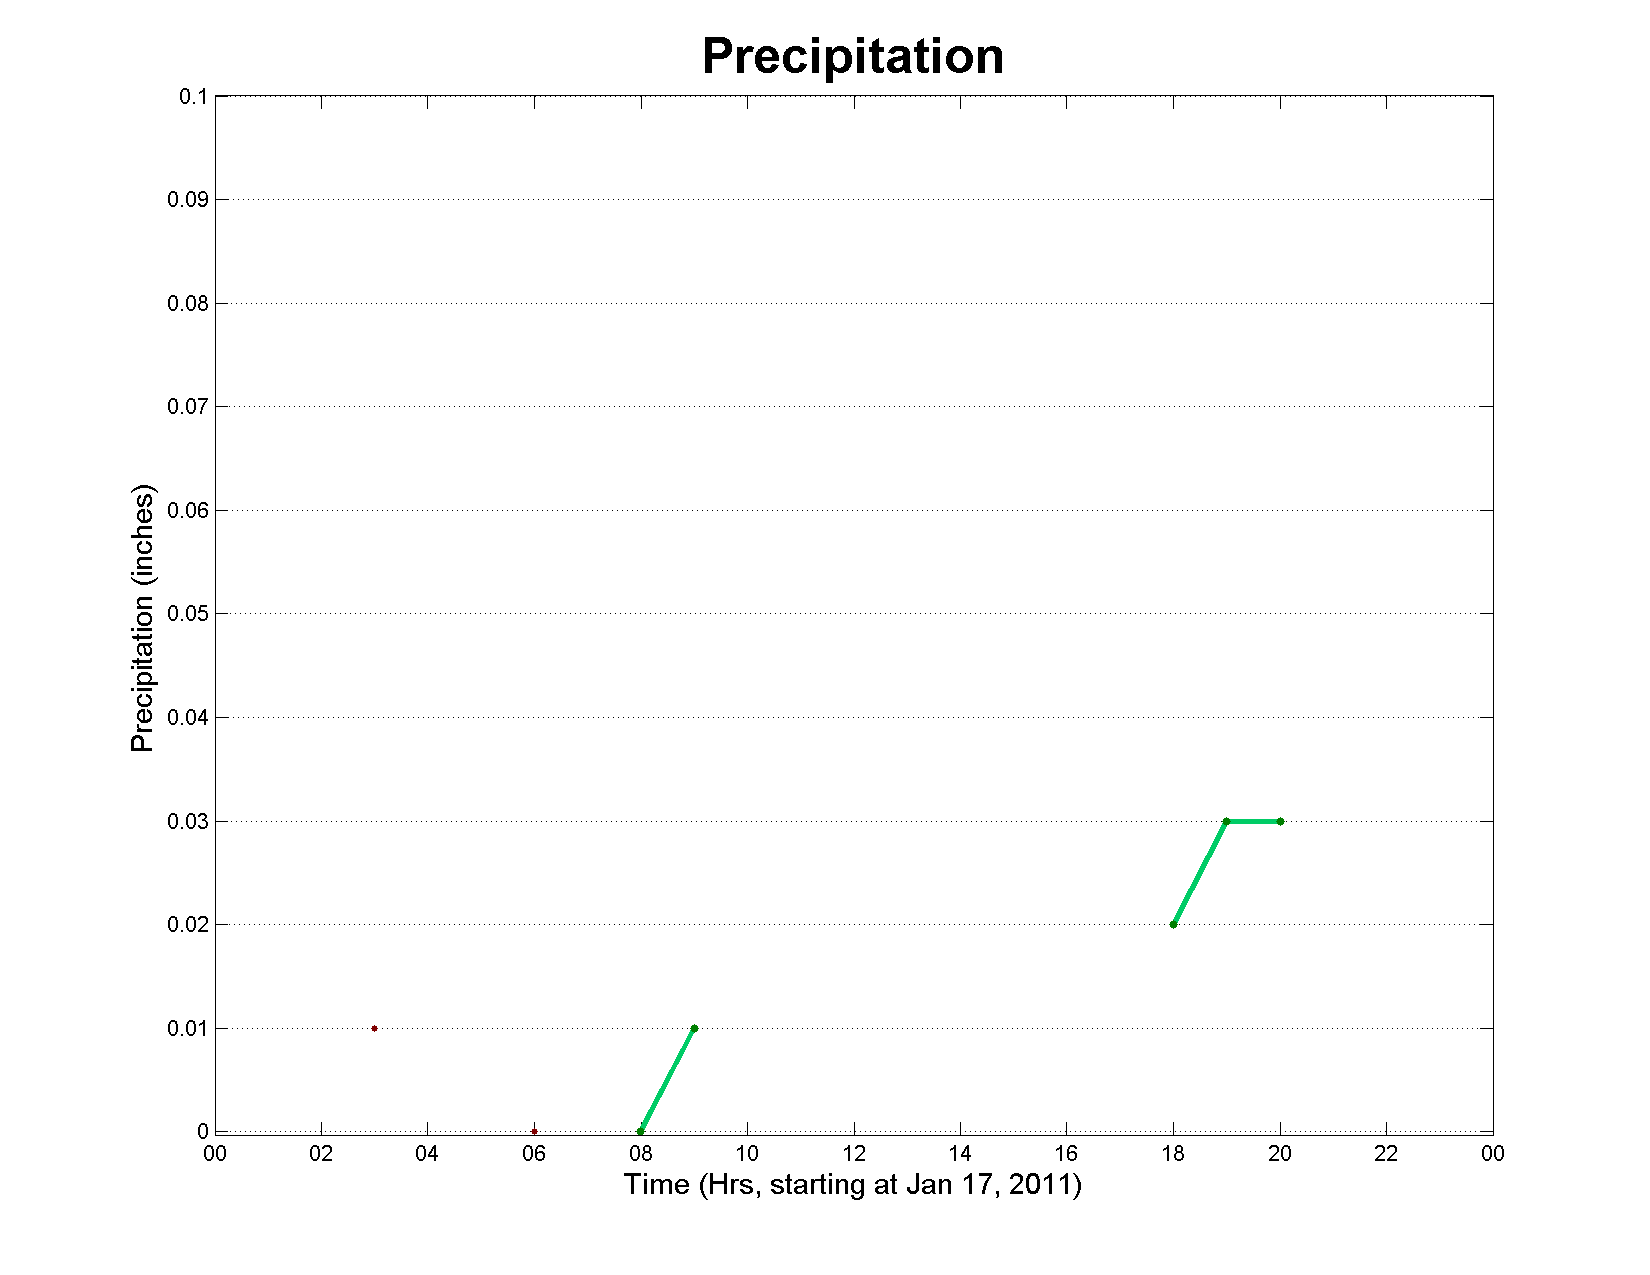
On January 17, 2011, a storm developed at about 06:40 UTC. Below are the dBZ, doppler velocity, and spectral width radar images and graphs of statistics during and around the storm. The areas of the graph colored green represent the time of the storm. All images link to a larger image.
January 17 (06:40 UTC - 20:21 UTC) |
1-day Graph: January 17 |
|
|
Storm Statistics |
Avg. Wind Direction: 170.8° |
Temperature |
Air Pressure |
Relative Humidity |
Wind Speed |
|
Average |
10.7°C |
1020 hPa |
83 | 3.8 m/s |
Maximum |
12.2°C |
1026 hPa |
96 | 8.0 m/s |
Minimum |
9.4°C |
1015 hPa |
68 | 0.0 m/s |